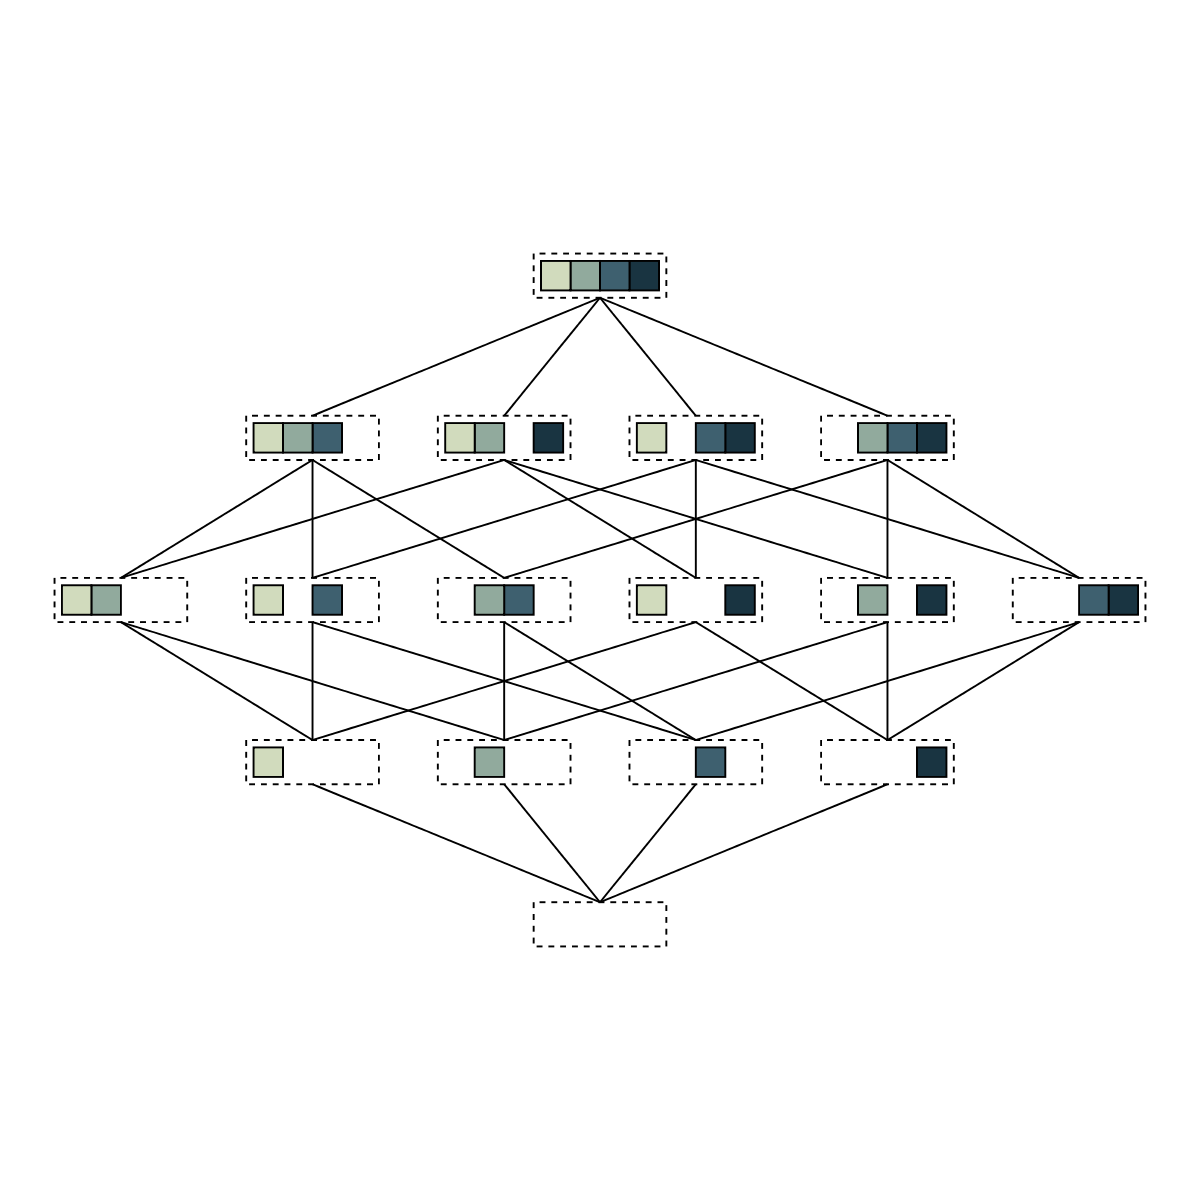
Hasse diagram of all subsets of a four-element set.
> import Diagrams.Backend.SVG.CmdLine> {-# LANGUAGE NoMonomorphismRestriction #-}
> import Diagrams.Prelude
> import Data.List
> import Data.Ord (comparing)
> import Data.Function (on)
> import Data.Maybe (fromMaybe)
> import Data.Colour.SRGB (sRGB24read)
>
> colors = map sRGB24read["#000000", "#D1DBBD", "#91AA9D", "#3E606F", "#193441", "#000000"]A subset is represented by the size of the parent set paired with the list of elements in the subset. isSubset tests whether one set is a subset of another; subsetsBySize lists all the subsets of a set of size n, grouped according to size.
> data Subset = Subset Int [Int]
>
> (Subset _ elts1) `isSubset` (Subset _ elts2) = all (`elem` elts2) elts1
>
> subsetsBySize :: Int -> [[Subset]]
> subsetsBySize n = map (map (Subset n))
>                 . groupBy ((==) `on` length)
>                 . sortBy (comparing length)
>                 . subsequences
>                 $ [1..n]
Draw the elements of a subset, by drawing a colored square for each element present, and leaving a blank space for absent elements.
> drawElts n elts = hcat
>                 . map (\i -> if i `elem` elts
>                                then drawElt i
>                                else strutX 1
>                       )
>                 $ [1..n]
>
> drawElt e = unitSquare # fc (colors !! e) # lw thin
Draw a subset by drawing a dashed rectangle around the elements. Note that we also assign a name to the rectangle, corresponding to the elements it contains, which we use to draw connections between subsets later.
> drawSet (Subset n elts) = (    drawElts n elts # centerXY
>                             <> rect (fromIntegral n + 0.5) 1.5
>                                  # dashingG [0.2,0.2] 0
>                                  # lw thin
>                                  # named elts
>                           )
Draw a Hasse diagram by drawing subsets grouped by size in rows, and connecting each set to its subsets in the row below. See the user manual for a more in-depth explanation of how names are used to connect subsets.
> hasseRow = centerX . hcat' (with & sep .~ 2) . map drawSet
>
> hasseDiagram n = setsD # drawConnections # centerXY
>   where setsD = vcat' (with & sep .~ fromIntegral n)
>               . map hasseRow
>               . reverse
>               $ subsets
>         subsets = subsetsBySize n
>         drawConnections = applyAll connections
To generate all the connections, we apply connectSome to each pair of adjacent rows, which calls connect on those pairs where one is a subset of the other.
>         connections = concat $ zipWith connectSome subsets (tail subsets)
>         connectSome subs1 subs2 = [ connect s1 s2 | s1 <- subs1
>                                                   , s2 <- subs2
>                                                   , s1 `isSubset` s2 ]
Connect two subsets by looking up the subdiagrams named with their elements, and drawing a line from the upper boundary of one to the lower boundary of the other.
>         connect (Subset _ elts1) (Subset _ elts2) =
>           withNames [elts1, elts2] $ \[b1, b2] ->
>             beneath ((boundaryFrom b1 unitY ~~ boundaryFrom b2 unit_Y) # lw thin)
>
> example = pad 1.1 $ hasseDiagram 4
> main = mainWith (example :: Diagram B)